
Abstract
This study aims to evaluate the performance of manufacturing companies operating in the international aerospace industry. In this context, the financial performance of 12 leading companies from 2019-2023 is analysed through multi-criteria decision-making processes using the CRITIC and ARAS methods. In order to evaluate the performance of the companies in question, a number of financial indicators are taken into consideration, including total capital, capital expenditures, gross income, operating expenses, total liabilities and working capital. The CRITIC method was employed to ascertain the relative importance of the criteria, while the ARAS method was utilised to evaluate the performance of the companies in question. The results demonstrate that the Transdigm Group is the most successful company, with General Electric consistently ranking second. Conversely, the performance of companies such as Airbus and Boeing has exhibited variability over time. The findings of this study offer valuable insights for strategic performance evaluation in the aerospace industry.
Keywords
- CRITIC
- ARAS
- MCDM
- Aerospace Industry
- Manufacturing Firms
1. Introduction
The aerospace sector exerts a considerable influence on the natural environment, the global economy and society at large (ATAG, 2014). The sector has experienced exponential growth in recent years as a consequence of urbanization. It is anticipated that demand for passenger travel will increase by five per cent per year over the next two decades, resulting in a projected requirement for 56,000 additional aircraft by 2040 (ICAO, 2013). The sector contributes approximately $664 billion to the global economy on an annual basis, with an estimated contribution of $1 trillion to the global GDP by 2026. A significant number of individuals are employed by major aircraft manufacturing companies, with Boeing alone employing over 150,000 people (Boeing, 2024). The aerospace industry is widely acknowledged as one of the most value-added industrial sectors in any economy (Hausmann et al., 2011). A significant number of countries worldwide have pursued the development of a domestic aerospace industry as a component of their national industrial development strategies. Examples of countries that have sought to develop an aerospace industry include Argentina in the late 1920s, Indonesia in the 1970s and, more recently, Portugal, the United Arab Emirates and several developing regions in Asia, which have been pursuing this goal since the beginning of this century. The motivations of governments seeking to create a national aerospace industry include enhancing international prestige, increasing military selfsufficiency and promoting economic development (Eriksson, 2023). Policy makers have focused on aircraft production with the rationale that the production of an entire aircraft can trigger the establishment of component and system suppliers in the vicinity, stimulating job creation, capacity building and economic growth (Niosi and Zhegu, 2005). The aircraft industry comprises a multitude of stakeholders, including original equipment manufacturers (OEMs) such as aircraft and component manufacturers. Prominent examples of OEMs in the industry include Boeing, Airbus, General Electric (GE) Aerospace, Lockheed Martin, BAE Systems, and RollsRoyce Holdings. The entities that provide maintenance, repair and overhaul (MRO) services are referred to as MROs. The customer base is comprised of commercial airline operators and the military. Additionally, aircraft and component manufacturers frequently function as service providers, offering maintenance packages to airline operators with the objective of generating postsales revenue. It is not uncommon for airline operators to integrate with MRO organizations, while OEMs frequently offer customers the option of customization (Singamneni et al., 2019). This sector makes significant contributions in areas such as technological innovations, large-scale projects and defense systems, and stands out as a strategic industry in which the largest companies operate worldwide (Bharadwaj et al., 2015). The financial performance of companies is critical for their competitiveness and sustainability in the sector (Kılıçlı and Aygün, 2023). Therefore, it is necessary to evaluate the performance of companies operating in the aerospace industry by considering the above factors. In this context, various methods have been developed to evaluate the performance of companies operating in this field (Vermeulen and Van Tooren, 2006; Noll, 2015; Hsieh et al., 2020), but it is seen that the application of multicriteria decision making (MCDM) methods is limited among these methods. The objective of this study is to analyze the financial performance of leading manufacturing companies in the international aerospace industry using MCDM methods. The study employs the CRITIC and ARAS methods to evaluate the performance of 12 companies operating within the aerospace industry. Financial indicators, including total capital, capital expenditures, gross income, operating expenses, total liabilities, and working capital, are employed as performance criteria. The combination of these methods provides a more comprehensive analysis of the financial health and overall performance of the companies in question. The continuation of the research is designed as follows: Firstly, an overview of the research conducted in the field of aviation using MCDM methods will be presented. The following section will present the methodology employed in the research, including an explanation of the MCDM methods utilized and the dataset. Subsequently, the research findings will be presented, and the study will conclude with a discussion of the conclusions and recommendations.
2. Literature Review
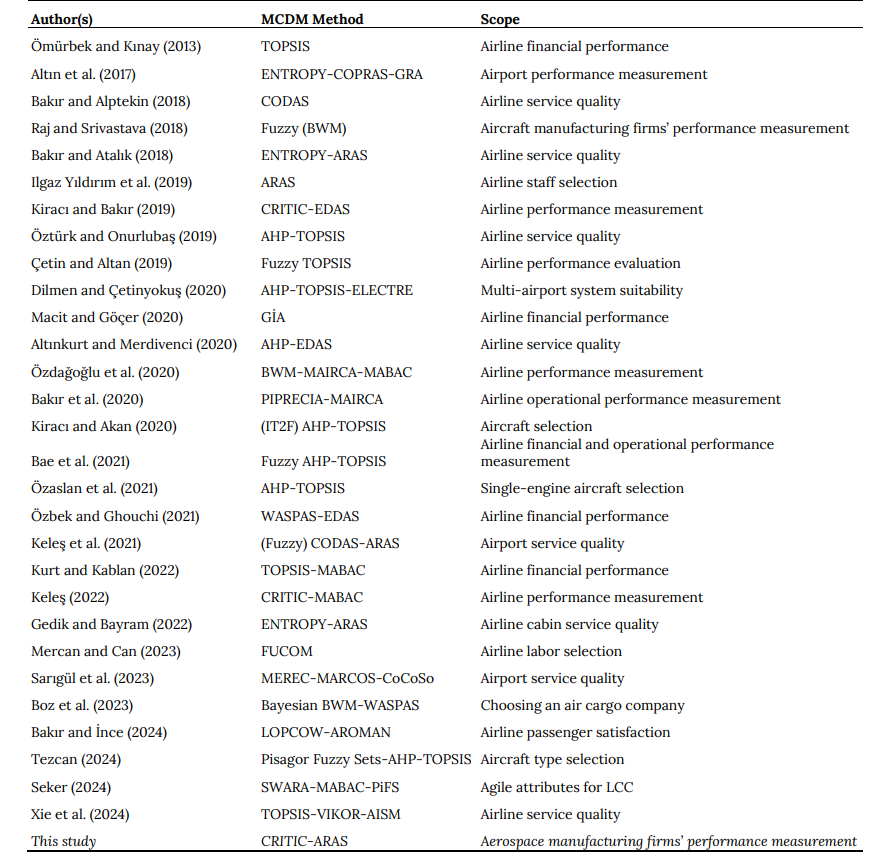
In the field of air transportation, research has been conducted in a number of areas, including the financial and operational performance measurement of airline companies, the performance evaluation of airports, the evaluation of airline and airport service quality, and the selection of personnel and aircraft using multi-criteria decision-making methods. Table 1 represents a summary of the aforementioned research. Ömürbek and Kınay (2013) employed the TOPSIS method to evaluate the financial performance of two airlines operating in Turkey and Germany. The results indicated that the Turkish airline exhibited superior performance compared to its German counterpart. In a similar vein, Altın et al. (2017) employed the ENTROPY-based COPRAS and Grey Relational Analysis (GRA) methods to evaluate Europe’s largest airports. Their findings revealed that the three airports with the highest performance ratings were the main airports in Madrid, Frankfurt and Paris, respectively. In a further study, Bakır and Alptekin (2018) used the CODAS method to evaluate the performance of airline companies in terms of both airport services and cabin services. The objective of Raj and Srivastava (2018) was to develop a composite index (CI) for the evaluation of the sustainability performance of an aircraft manufacturing company, employing the Fuzzy Best Worst Multi-Criteria (FBWM) decision-making approach. The findings of the study indicated that economic considerations represent the most influential aspect of sustainability within the aerospace industry. Bakır and Atalık (2018) applied the ENTROPY-based ARAS method to evaluate the quality of airline services. The findings of the study indicate that the Japanese flag carrier All Nippon Airways provides the optimal level of service quality. In a further study, Ilgaz Yıldırım et al. (2019) employed the ARAS method to evaluate the criteria used in the selection of airline personnel. The findings of the research indicated that sectoral competence is the most crucial criterion for support staff. Kiracı and Bakır (2019) used the CRITIC-based EDAS method to evaluate the operational performance of airline businesses. Their findings revealed that these businesses were negatively affected by the global economic crisis of 2008. Öztürk and Onurlubaş (2019) adopted subjective methods to weight airline service quality criteria and employed the TOPSIS method to rank airline businesses. In their study, Çetin and Altan (2019) evaluated airline performance using the Fuzzy TOPSIS method. The most significant criterion among the evaluated criteria was ‘Large and New Aircraft’. The criterion with the lowest level of importance was ‘Sales Office/Agency Services’. In the ranking of airline companies, Turkish Airlines is identified as the bestperforming company. Dilmen and Çetinyokuş (2020) evaluated the feasibility of a multi-airport system in the context of Ankara province using the AHP-TOPSIS-ELECTRE method. A financial performance analysis of Pegasus and Turkish Airlines was conducted by Macit and Göçer (2020), employing the Grey Relational Analysis method. The findings of the research indicate that Pegasus exhibits superior financial performance in comparison to Turkish Airlines; however, Turkish Airlines displays a more favorable profitability ratio. In a similar vein, Altınkurt and Merdivenci (2020) conducted an evaluation of the service quality provided by airline companies that cater to business travelers, applying the AHP and EDAS method. The findings of the research indicate that airline companies with their origins in the Far East perform better. Özdağoğlu et al. (2020) performed an analysis of the performance of airline companies utilizing Isparta Süleyman Demirel Airport, undertaking this assessment employing the BWM, MAIRCA, and MABAC methods. In 2020, a hybrid multi-criteria decision-making model was proposed, based on the integration of PIPRECIA and MAIRCA methods, for the evaluation of the operational performance of airline companies operating in emerging markets. The study concluded that the most significant performance indicator is operating costs (Bakır et al., 2020). In a departure from the approaches taken by other studies in the literature, Kiracı and Akan (2020) utilized a hybrid methodology combining the Interval Type-2 Fuzzy Analytical Hierarchy Process (IT2FAHP) and the Interval Type-2 Fuzzy Technique (IT2FTOPSIS) for the purpose of aircraft selection. The findings indicate that the Airbus A321neo is the optimal commercial aircraft for airlines in technical, economic, and environmental terms. Bae et al. (2021) aim to assess the competitiveness of airlines and evaluate their financial and operational performance according to these criteria. The researchers test a hybrid method that combines FAHP and TOPSIS methods. Özaslan et al. (2021) used AHP and TOPSIS methods in the selection of single-engine piston aircraft. Özbek and Ghouchi (2021) evaluated the financial performance of the leading European airlines using the WASPAS-based EDAS method. Keleş et al. (2021) evaluated the service quality of airports in terms of passengers using fuzzy CODAS and ARAS methods. Kurt and Kablan (2022) investigated the impact of Covid19 on airline financial performance using TOPSISMABAC methods. Keleş (2022) analyzed the performance measurement of THY over the years using the CRITICbased MABAC method. Gedik and Bayram (2022) analyzed the cabin service quality of airlines with ENTROPY-based ARAS. The results show that the best airlines are Norwegian, Easy Jet and Vueling. Mercan and Can (2023) investigated the factors that are effective in the selection of employees in airline companies using the FUCOM method. The results show that technical competence is the most important selection criterion. Sarıgül et al. (2023) determined the service quality evaluation at airports with the MERECbased hybrid MARCOS-CoCoSo method. Boz et al. (2023) performed the selection of air cargo operations using the Bayesian BWM-WASPAS method. The main criteria of economy and quality were identified as the most important criteria in the selection. Bakır and İnce (2024) used the LOPCOW-AROMAN model in airline passenger satisfaction. Tezcan (2024) proposed a model with AHP and TOPSIS methods integrated with Pythagorean fuzzy sets in aircraft type selection for airlines. The research results show that Airbus A350-1000 aircraft is the most ideal aircraft. Seker (2024) identified agile features for LCCs with integrated SWARA, MABAC, and Picture Fuzzy Sets method. Xie et al. (2024) evaluated airline service quality using text mining and the TOPSIS, VIKOR and AISM methods from the CRM methods
3. Methodology
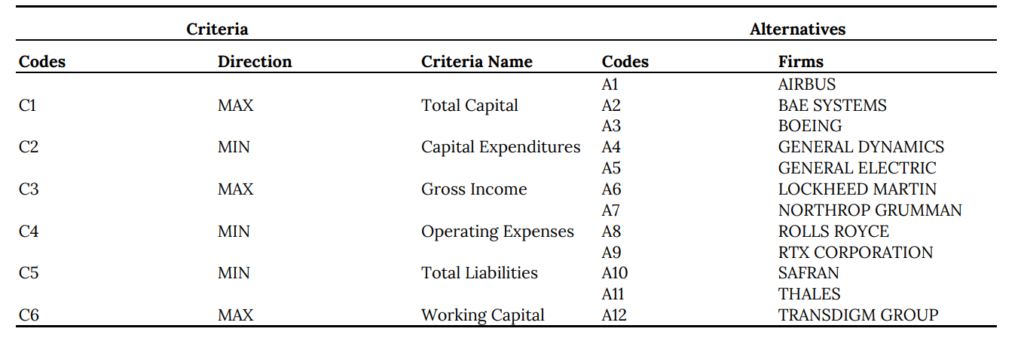
The research evaluated the performance of international aerospace manufacturing companies. In this context, CRITIC and ARAS, which are widely used MCDM methods in this field, were used in an integrated way. The CRITIC method was used to obtain the weights of the evaluation criteria, and the ARAS method was used to rank the companies. The companies included in the study are among the world’s leading organizations in the engineering, aerospace and aviation industries. These companies often focus on large-scale defense projects, commercial aircraft manufacturing, aerospace engines, space exploration and cyber security solutions. They also provide state-of-the-art infrastructure and solutions to commercial and military customers. Others manufacture only commercial aircraft, serving major airlines and producing cutting-edge technologies that are reshaping the commercial aviation industry. MCDM uses a set of criteria selected to comprehensively assess the financial performance and overall well-being of the firm. The term ‘total capital’ refers to all the financial resources of the firm (Antonelli et al., 2023), while capital expenditure describes the significant expenditures made to develop or acquire long-term assets (Beranek et al., 1995).
Table 1. Studies Using MCDM Methods in Air Transportation
The amount of money generated from sales after deducting direct costs is known as gross revenue, which indicates how profitable the company is (Abdel-Basset et al., 2020). Operating expenses are a measure of the operational efficiency of a company, as they represent the regular costs incurred to maintain its main activities (Khalid and Khan, 2017). Working capital is the difference between short-term assets and liabilities and indicates the ability of the business to finance its day-to-day operations (Baños-Caballero et al., 2010), while total liabilities cover the debts and obligations of the business to third parties (Rehwinkel, 2016). These parameters allow the analysis of many different financial scenarios, ranging from the growth capacity of the company to its debt position. Table 2 lists the research criteria and alternatives used.
Table 2. Criteria and Alternatives Used in the Study
3.1 Weighting of Criteria: CRITIC Method
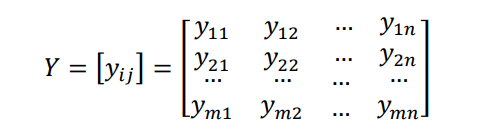
The Criteria Importance Through Intercriteria Correlation (CRITIC) method, as proposed by Diakoulaki et al., (1995), (Houqiang and Ling, 2012; Xie et al., 2014), is primarily used for the determination of the weight of the attributes. In the CRITIC method, the weighting process is performed by taking into account the standard deviation of the decision matrix for the evaluation criteria and the correlation coefficient of these criteria (Çakır and Perçin, 2013). This method is based on the premise that the features do not contradict one another, and the weights of the features are determined using the decision matrix. The CRITIC method has been applied in various fields, including automatic areal feature matching (Kim et al., 2011; Kim and Yu, 2015), medical quality assessment (Ping, 2014) and ranking of processing procedures (Madic and Radovanovic, 2015). The application stages of the CRITIC method are outlined below (Diakoulaki et al., 1995): In the CRITIC method, the decision matrix must be prepared first. The decision matrix is given in equation 1
In order to show the direction and strength of the
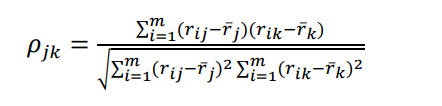
relationship between the evaluation criteria, a matrix R = (𝜌𝑗𝑘)mxm consisting of linear correlation coefficients (𝜌𝑗𝑘) is created and the correlation coefficient of the relevant criteria is calculated using (Eq 4).
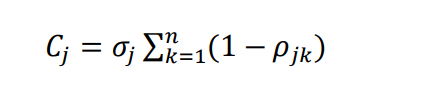
(Eq 5) is used to determine the value 𝜎𝑗, which indicates the standard deviation value of each evaluation criterion, and 𝐶𝑗, which expresses the amount of information for each evaluation criterion.
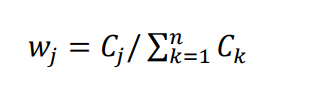
Finally, the weight value of each evaluation criterion is calculated using (Eq 6) and the criterion weights are
obtained.
3.2 Ranking of Alternatives: ARAS Method
ARAS (Additive Ratio Assessment Method), one of the MCDM, was developed by Zavadskas and Turskis in 2010. According to Ilgaz Yıldırım et al., (2019), this method assigns the values of the selection alternatives with their ratios to the ideal decision alternative according to the utility function. A feature that distinguishes the ARAS method from the other MCDM techniques in the literature is that it compares the utility function values of the alternatives with the value of the alternative in the ideal scenario (Bakır and Atalık, 2018). The following steps constitute the ARAS technique (Zavadskas and Turskis, 2010):
First, the decision matrix is constructed as in (Eq 7):
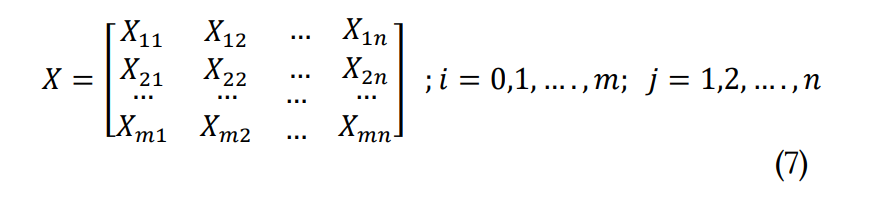
In this matrix there are 𝑚 options and 𝑛 evaluation criteria. If the reference value for the criteria is not known, the best value based on the benefit (maximum) or cost (minimum) characteristic is determined using (Eq 8):
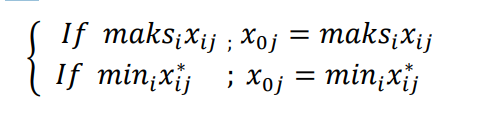
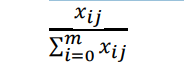
Obtaining the normalized decision matrix is the next step. The process of standardizing the criteria in the range of 0 to 1 is known as normalizing the criteria. During the normalization process, (Eq 9) and (Eq 10) are used to calculate the normalized values of the criteria that are desired to be maximum or minimum according to the problem objective.
𝑜𝑟 𝑐𝑟𝑖𝑡𝑒𝑟𝑖𝑎 𝑡ℎ𝑎𝑡 𝑎𝑟𝑒 𝑟𝑒𝑞𝑢𝑖𝑟𝑒𝑑 𝑡𝑜 𝑡𝑎𝑘𝑒 𝑡ℎ𝑒 𝑚𝑎𝑥𝑖𝑚𝑢𝑚 𝑣𝑎𝑙𝑢𝑒:
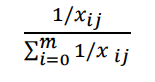
𝑓𝑜𝑟 𝑐𝑟𝑖𝑡𝑒𝑟𝑖𝑎 𝑡ℎ𝑎𝑡 𝑎𝑟𝑒 𝑟𝑒𝑞𝑢𝑖𝑟𝑒𝑑 𝑡𝑜 𝑡𝑎𝑘𝑒 𝑡ℎ𝑒 𝑚𝑖𝑛𝑖𝑚𝑢𝑚 𝑣𝑎𝑙𝑢𝑒:
The next step is to obtain the weighted normalized decision matrix. The importance coefficients of the criteria are used to perform the weighting step following the normalization step. According to Zavadskas and Turskis (2010), the importance coefficients of the criteria must satisfy the condition 0 < 𝑤j < 1. (Eq 11) provides the following formula to obtain the normalized weights:
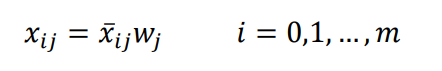
The normalized value of criterion 𝑗 is denoted by 𝑥̅𝑖𝑗 in the (Eq 11), where 𝑤𝑗 is the importance coefficient of criterion j. In the next step, the optimality function (𝑆𝑖) is calculated. In this step, the best values for each alternative are determined. Equation (12) is used to calculate the values of the alternatives.
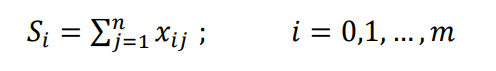
The optimality function of the 𝑖-th alternative is denoted by 𝑆𝑖. Following this procedure, the 𝑆𝑖 values of the alternatives are divided by the optimal value 𝑆0 to determine the 𝐾𝑖 utility ratings. Equation (13) is used to determine the 𝐾𝑖 values.
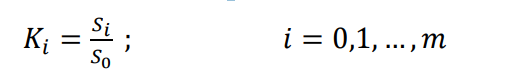
The 𝐾𝑖 values obtained are used to analyse the efficiency of the utility functions of the alternatives. This is equivalent to ranking the alternatives from best to worst and ranking the 𝐾𝑖 values from largest to smallest (Zavadskas and Turskis, 2010). The 𝐾𝑖 value is between 0 and 1. The relative utility efficiency of the alternatives is calculated using the 𝐾𝑖 values obtained. These values are then ranked from largest to smallest and the selection alternatives are evaluated (Ilgaz Yıldırım et al., 2019).
4. Results
This part of the research provides information on the application stages of the CRITIC and ARAS methods. As part of the study, the performance indicators of 12 companies in the international aerospace manufacturing industry were analyzed for the period from 2019 to 2023. Six financial indicators were included in the research.
4.1 CRITIC Results
The initial step involved the implementation of the CRITIC method for the purpose of assigning weights to the performance indicators. In this study, the weighting process was carried out separately for each year of the 2019-2023 period, as the criteria weights used for each year were derived from the decision matrix. However, for the sake of exemplification and to conserve space, only the weighting process conducted on the data from 2023 is presented here.
In the initial phase of the CRITIC method, a decision matrix is constructed to represent the evaluation criteria. In this case, the decision matrix comprised 12 manufacturing enterprises operating in the aerospace industry (Alternative) and 6 criteria (Indicator), organized using (Eq 1). The resulting decision matrix for these enterprises is presented in Table 3.
As shown in Table 3, firms A10 (Safran) and A11 (Thales) report negative working capital. This situation may initially appear as a data anomaly; however, it can also be interpreted as a characteristic of capital-intensive industries such as aerospace and defense. In such sectors, firms often have high short-term liabilities due to large-scale production contracts and advance payments, which may temporarily result in negative working capital without necessarily implying financial distress.
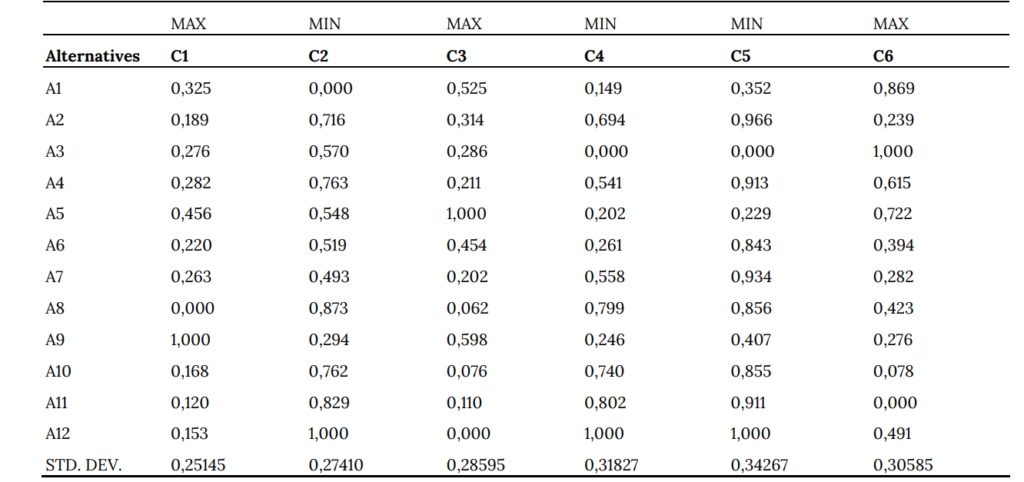
In the second stage of the CRITIC method, the decision matrix is normalized according to the benefit or cost nature of each criterion, as shown in (Eq 2). During this normalization process, the minimum and maximum values of each criterion are first identified. Then, the normalized values are calculated using (Eq 2), which adjusts each value based on the type of criterion (benefit or cost). Specifically, for benefit-type criteria, normalization is achieved by dividing each value by the sum of the values in its column, whereas for cost-type criteria, the inverse approach is used. The resulting normalized decision matrix is presented in Table 4.
In the subsequent phase of the CRITIC approach, the direction and intensity of the relationship between the performance measurement criteria were determined by applying a correlation analysis to the relevant criteria with the assistance of (Eq 3). Table 5 presents the findings of the correlation analysis conducted on the performance measurement criteria.
Table 3. Initial Decision Matrix (2023)
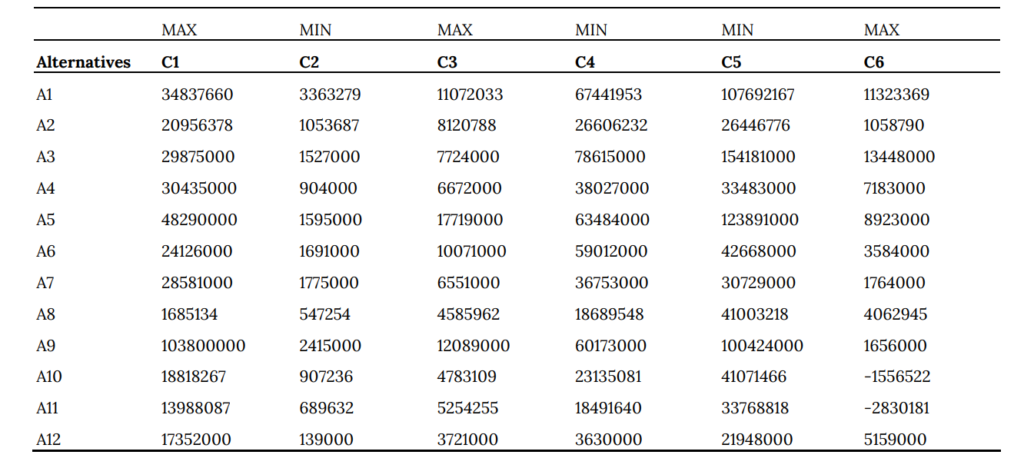
Table 4. Normalized Decision Matrix (2023)
In the final phase of the CRITIC technique, the quantity of information and the weights assigned to the criteria are determined. In this context, the information amount (Cj) is initially determined through the application of (Eq 4). Subsequently, the value of (Cj) for each criterion is divided by the total value of (Cj) for all criteria. The resulting value is then expressed as the criterion weight value, which is calculated with the help of Equation (5). Table 6 presents the (Cj) and (Wj) values for the performance measurement criteria. Up to this point in the analysis, only the criterion weight value and the amount of information value for 2023 have been determined. The criteria weight values for the 2019-2023 period are presented in Table 7. Table 7 illustrates that the weight values attributed to the criteria of aerospace manufacturing firms included in the study for the 2019-2023 period fall within the range of 0.133-0.209. The rankings of the criteria weights vary from year to year. Consequently, when the evaluation is made on the basis of the 2023 period, it is evident that the variable with the lowest weight on the performance of aerospace manufacturing firms is Capital Expenditures (C2), while the variable with the highest weight is Working Capital (C6). The weight change graph of the criteria weights for different years is provided in Figure 1 for reference.
Table 5. Correlation Matrix (2023)
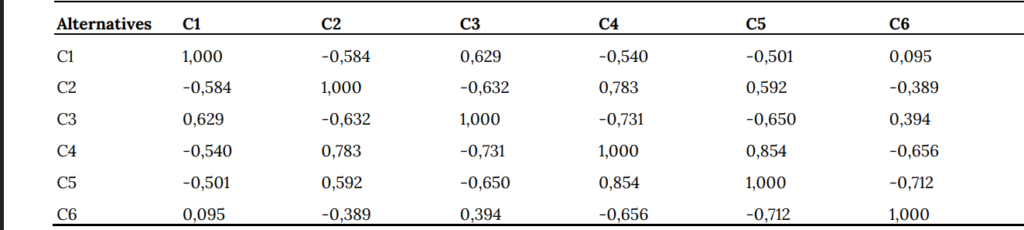
Table 6. Amount of Information and Criterion Weight Value (2023)
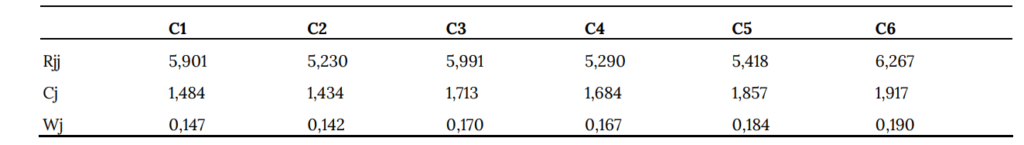
Table 7. Weight of criteria (2019-2023)
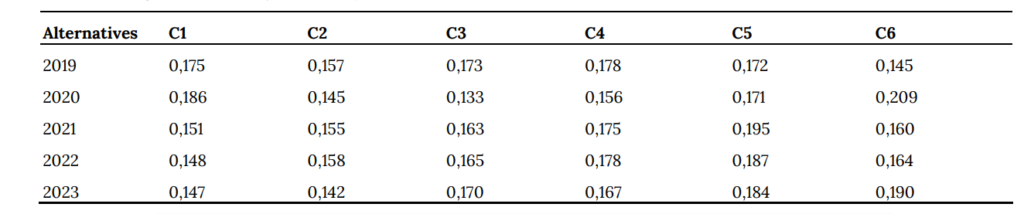
Fig. 1. Weight Level Change of Performance Criteria by Years (2019-2023)
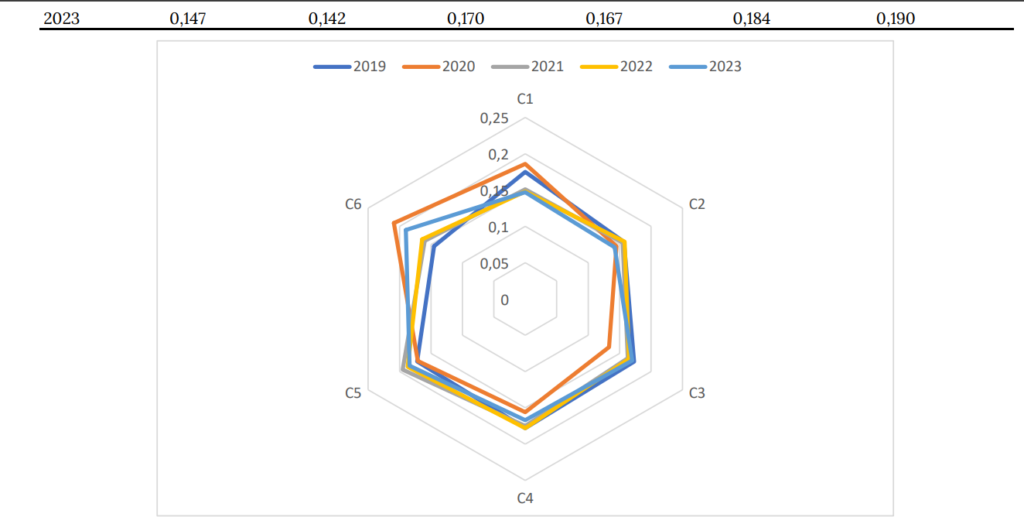
Table 8. Initial Decision Matrix for ARAS (2023)
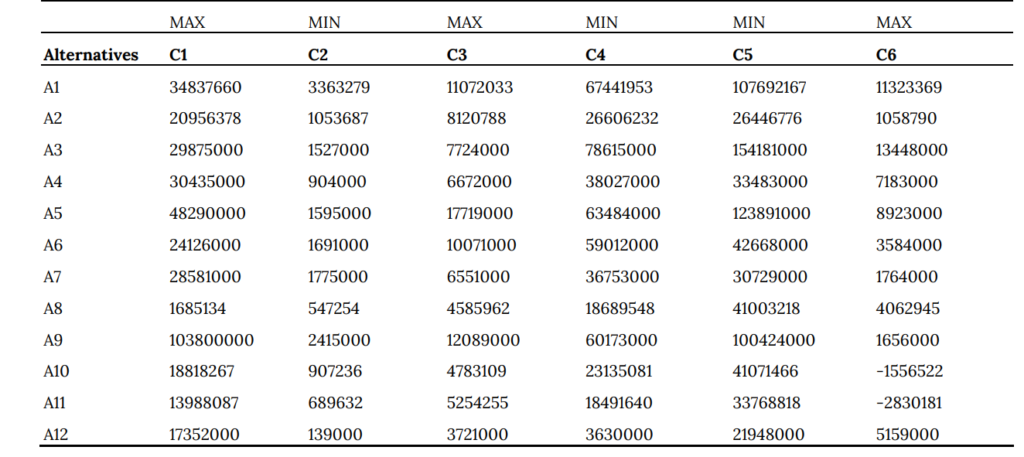
Table 9. Transformed Decision Matrix for ARAS (2023)
4.2 ARAS Results
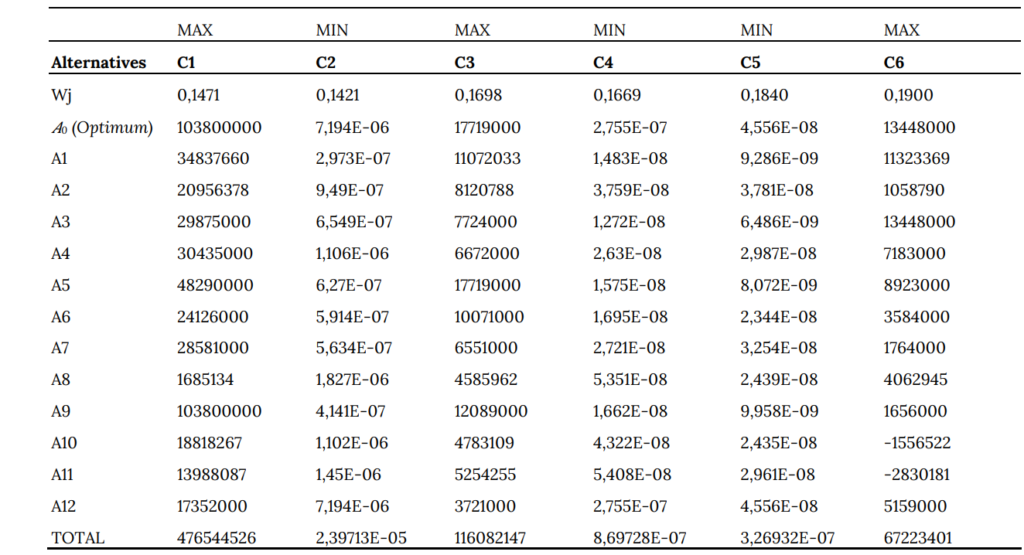
In this section, the decision matrix employed in the Entropy method calculations is utilized to rank the alternatives by evaluating the performance of aerospace manufacturing firms in accordance with the ARAS method. In this context, the initial decision matrix is presented in Table 8. Moreover, the ARAS approach is structured in a way that makes (Eq 7) the optimal means of generating the criterion values, which are then represented in the decision matrix. The values in each column of the matrix in Table 9 are selected with the objective of obtaining the optimal values 𝐴0 based on the cost or benefit attribute. In the ARAS method, an additional artificial alternative, referred to as A0 (optimum), is introduced to serve as the ideal solution against which all other alternatives are compared. A0 represents the best achievable values across all criteria, allowing the relative utility of each real alternative to be measured. In this study, A0 was generated based on the maximum or minimum values for each criterion, depending on whether the criterion is benefit-type or cost-type. The normalized decision matrix is presented in Table 10 for reference. In order to transform the selection matrix into standardized values, (Eq 8) and (Eq 9) are employed to normalize it subsequent to the addition of optimal values to the data set. (Eq 8) is employed for criteria C1, C3 and C6, while (Eq 9) is utilized for the remaining criteria. The weight coefficients, which represent the relative importance of the alternatives, are multiplied by the scores of the alternatives in the ARAS technique. At this stage, Table 10 is used for the weighting process, and (Eq 10) is used to determine the Entropy weight values. For example, the Entropy weight for criterion C1 is multiplied by each column element in Table 10 to obtain weighted values. Table 11 shows the selection matrix produced after weighting
Table 10. Normalized Decision Matrix for ARAS (2023)
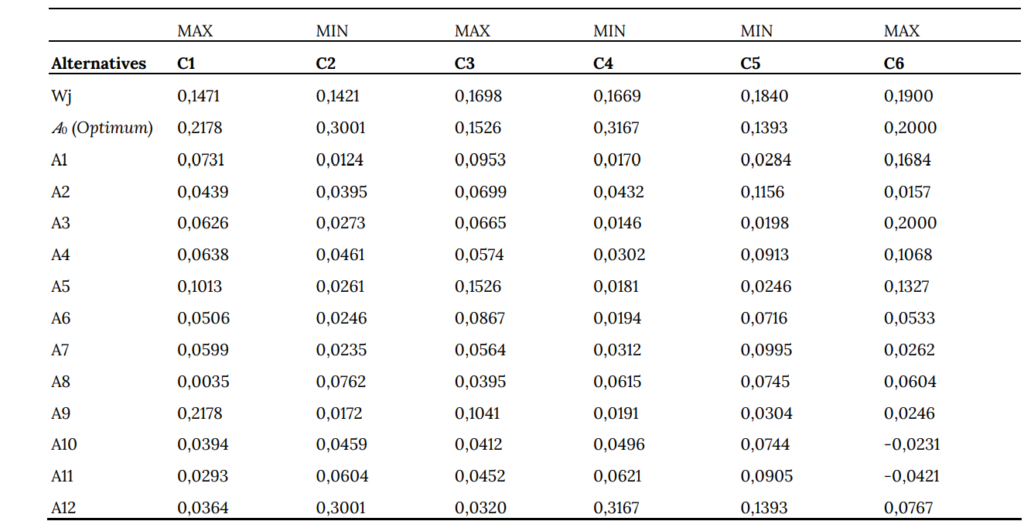
Table 11. Weighted Normalized Matrix for ARAS (2023)
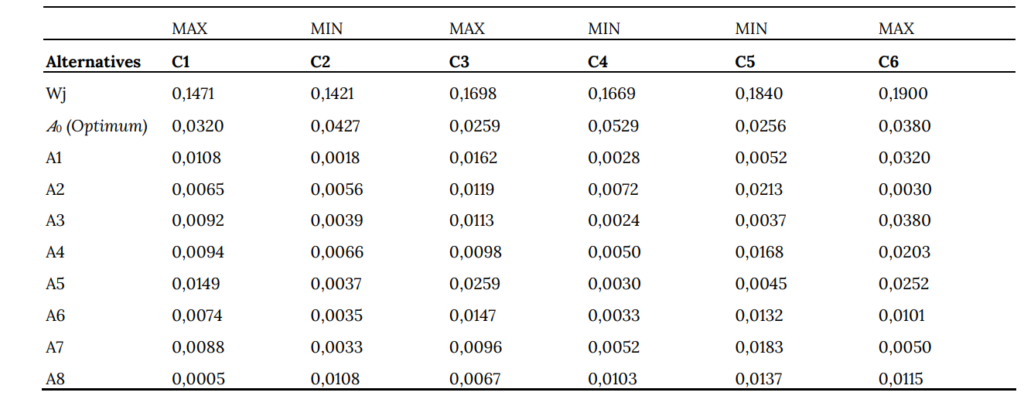
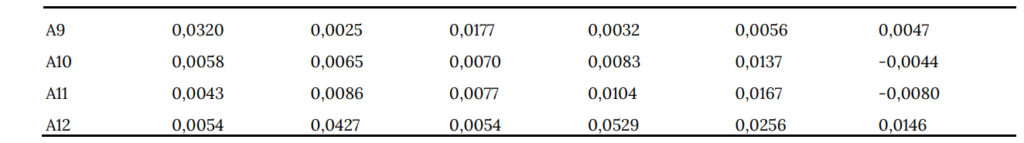
Table 12. The Optimality Function (2019-2023)
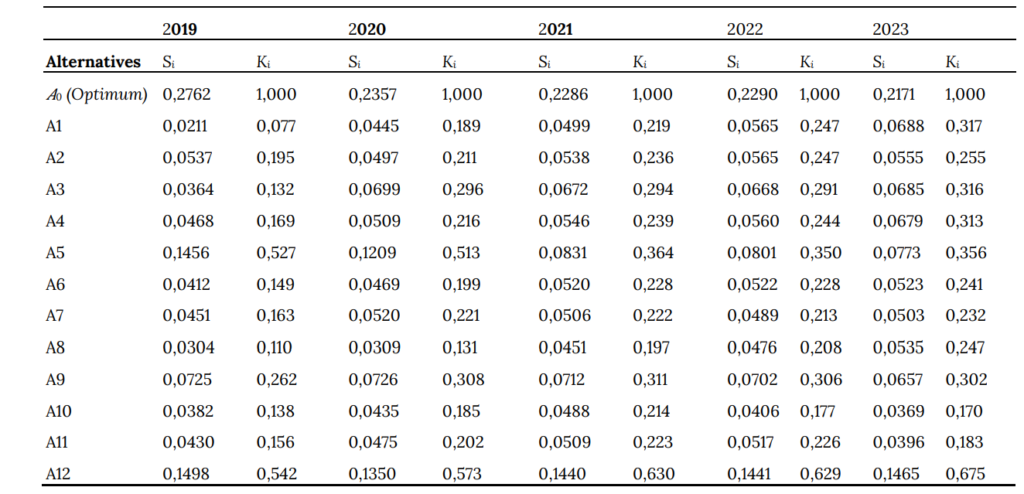
Table 13. Ranking of the Firms (2019-2023)
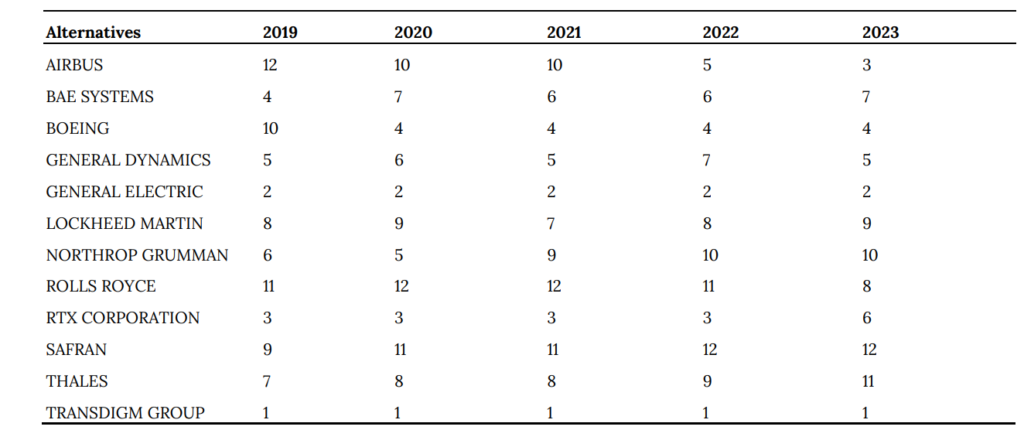
Once the weighted normalized decision matrix had been obtained, the values of the optimality function for each choice were generated. At this juncture, (Eq 11) and (Eq 12) were employed to derive the utility degrees Ki and Si, respectively. Table 12 presents the optimality functional values for the 2019-2023 time period. The equation 𝑆𝑖/𝑆0 was employed to calculate the 𝐾𝑖 values obtained in the preceding step. The 𝑆𝑖 value employed in this step is derived from the data obtained in the preceding step, whereas the 𝑆0 value represents the fixed 𝑆𝑖 value of option A0. Ultimately, the alternatives are evaluated according to their performance, with the ranking of the 𝐾𝑖 utility degrees from largest to smallest serving as a basis for this assessment. Table 13 illustrates the rankings of the enterprises for the 2019-2023 period, as determined by the application of the ARAS method. The TransDigm Group has demonstrated superior performance and stability relative to other companies, consistently occupying the top position (rank 1) over the past five years. Furthermore, General Electric has attained a robust and resilient standing, ranking second for a period of five years. This suggests the existence of a stable financial position or competitive advantages in the market. Airbus has demonstrated a noteworthy advancement, ascending from the 12th position in 2019 to the 3rd position in 2023. This upward trajectory may be attributed to strategic alterations or operational enhancements that have augmented the company’s performance. BAE Systems and General Dynamics demonstrate a moderate degree of consistency, occupying positions between fourth and seventh over the course of the observation period. While these companies continue to perform in a consistent manner, they are not exceptional performers, exhibiting neither significant progress nor decline. Boeing commenced 2019 in tenth position but has since maintained a consistent performance, occupying fourth place from 2020 to 2023. Boeing’s ranking suggests that the company will recover and demonstrate resilience in the coming years, despite the challenges it has faced, including those resulting from the 737 MAX crisis. The fluctuating rankings of Lockheed Martin, Northrop Grumman, Rolls-Royce and Thales, which are typically situated in the lower echelons of the table, suggest a lack of consistency in performance or the ability to sustain a trajectory of steady growth. Safran’s consistent ranking between 9th and 12th places demonstrates that, despite facing certain challenges in comparison to other companies in the sector, it has not declined significantly over time. Between 2019 and 2022, RTX Corporation (formerly Raytheon) retained its third position; however, it declined to sixth place in 2023. This may be indicative of an underlying issue or shift in the company’s strategic direction.
5. Discussion and Conclusion
The principal aim of this study is to evaluate the performance of aerospace companies through the application of multi-criteria decision-making techniques utilizing a range of financial indicators. In this context, the performance of 12 aerospace companies over the period 2019-2023 is analyzed. The CRITIC method was employed to ascertain the significance and weighting of the criteria to be utilized in the study, while the ARAS method was used to rank the firms according to their performance. In the context of this study, a number of financial variables were employed as performance indicators for the enterprises in question. These included total capital, working capital, gross income, capital expenditures, operating expenses and total liabilities. The application of the CRITIC method resulted in differing weights for the criteria on an annual basis. In the 2023 period, the most significant evaluation criterion is working capital (0.190), followed by total liabilities (0.184), gross revenue (0.170), operating expenses (0.167), total capital (0.147), and capital expenditures (0.142). In the 2021-2022 period, the criterion with the highest weight value was total liabilities, while the criterion with the lowest weight value was total capital. In the 2020 assessment, working capital was identified as the criterion with the highest weight, while gross income was identified as the criterion with the lowest weight. In 2019, operating expenses were identified as the criterion with the highest weight, while working capital was identified as the criterion with the lowest weight. The results of the performance evaluation conducted using the ARAS method, subsequent to the CRITIC method, indicate that Transdigm Group is the most effective enterprise across all years, with General Electric ranking second. In the 2023 period, Airbus was ranked third and Boeing was ranked fourth. In the selected period, it was observed that the performance rankings of some enterprises exhibited fluctuations from year to year, while others demonstrated a relatively stable outlook. Specifically, the strong and consistent performance of TransDigm Group and General Electric can be explained by their favorable values across the most influential indicators — particularly working capital and total liabilities, which had the highest weights in 2023 according to the CRITIC method (0.190 and 0.184, respectively). TransDigm consistently demonstrates robust working capital levels, indicating efficient shortterm financial management and liquidity. At the same time, it maintains relatively low liabilities, improving its overall financial risk profile. These two criteria alone accounted for nearly 38% of the total weight in 2023, significantly boosting the firm’s final performance score under the ARAS method. Similarly, General Electric’s strong results stem from a combination of high gross income and solid working capital, which aligns with the next most significant criteria weights (gross income: 0.170; total capital: 0.147). This suggests strong operational efficiency and revenue generation capacity. These firms outperformed their peers not necessarily because they had the best values in every criterion, but because they consistently performed well across those criteria deemed most important in each year — a fact captured dynamically by the CRITIC weighting system. This clarification helps better interpret the performance results and the strategic advantages of the topperforming firms. The findings of this study have important strategic implications for stakeholders in the aerospace industry. Given the prominence of working capital and total liabilities in performance evaluation, firms should prioritize liquidity management and debt optimization to strengthen their financial standing. Moreover, consistent performers like TransDigm and GE provide benchmarks for best practices in financial planning, investment control, and capital efficiency. For investors and managers, this study highlights the critical indicators that most significantly influence firm performance in this capital-intensive and technologically demanding sector. The findings of this study provide important insights into the financial performance dynamics of the aerospace manufacturing sector and contribute to the growing body of literature on multi-criteria decision-making (MCDM) applications in industrial performance assessment. The results confirm that certain financial indicators—particularly working capital and total liabilities—carry significant weight in performance evaluation, as also emphasized by Baños-Caballero et al. (2010) and Rehwinkel (2016), who highlighted the relevance of liquidity and debt management for sustainable firm performance. The consistent top-ranking of TransDigm Group across all five years reveals a strong and stable financial structure. This performance is supported by the company’s ability to manage short-term assets effectively and minimize excessive liabilities, aligning with Antonelli et al. (2023), who emphasized that optimized capital utilization enhances firm value and long-term competitiveness. Similarly, General Electric maintained a second-place position throughout the period, reflecting robust gross income and operational efficiency, in line with findings by Abdel-Basset et al. (2020) and Khalid & Khan (2017), who noted that high revenue generation combined with controlled operating costs is a key determinant of superior financial outcomes. In contrast, companies like Rolls-Royce, Safran, and Thales exhibited more volatile or consistently lower rankings, which may reflect strategic challenges, suboptimal capital expenditures, or liquidity pressures. The variability observed in Airbus and Boeing’s rankings across the years is noteworthy. While Boeing recovered to a higher ranking after a downturn—potentially reflecting post-crisis stabilization—Airbus showed a marked improvement by 2023, which could be linked to operational reforms or post-pandemic recovery strategies. These trends underscore the sector’s sensitivity to external shocks, such as the COVID-19 crisis, as also discussed by Kurt and Kablan (2022). From a methodological perspective, the integration of CRITIC and ARAS proved to be effective in capturing both the objective importance of criteria and the relative performance of firms. This aligns with prior studies such as Kiracı and Bakır (2019) and Bakır et al. (2020), who demonstrated the value of hybrid MCDM models in handling multidimensional financial data and generating actionable rankings for managerial decision-making. Objective weighting methods like CRITIC offer distinct advantages over purely subjective approaches by capturing both the variability and interdependence among criteria, leading to more robust and data-driven evaluations. This reinforces the notion suggested by Diakoulaki et al. (1995) that objective MCDM tools can improve transparency and reliability in performance assessment models. The study was conducted with the objective of evaluating the performance of firms engaged in manufacturing activities within the aviation and aerospace industry. In the course of this evaluation, a number of limitations were encountered. Firstly, although the study was designed to be conducted on the 20 largest aerospace and defense industry companies globally, the necessary data could not be obtained, resulting in the study being evaluated on 12 existing enterprises. Furthermore, the narrow scope of the study, encompassing only six evaluation criteria, represents another limitation. In future studies, it would be beneficial to diversify the weighting and ranking methods employed in order to facilitate a more nuanced comparison of the findings. In this context, weighting can be performed with methods such as LOPCOW and ENTROPY, while ranking can be performed with methods such as TOPSIS, VIKOR, EDAS, WASPAS and CODAS. Furthermore, the integration of fuzzy methods enables the revelation of situations in uncertain environments. In addition to the objective methods enumerated above, the evaluation of performance can be informed by the incorporation of subjective criteria. In this context, methods such as AHP, BWM and SWARA can be employed for this purpose, with the results subjected to comparative analysis.
CRediT Author Statement
Mehmet Yaşar: Conceptualization, Methodology,
Software, Data curation, Writing- Original draft
preparation, Visualization, Writing- Reviewing and
Editing.
Nomenclature
CRITIC : Criteria Importance Through Intercriteria Correlation
ARAS : Additive Ratio Assessment
MCDM : Multi Criteria Decision Making
ATAG : Air Transport Research Group
GDP : Gross Domestic Product
GE : General Electric
OEM : Original Equipment Manufacturer
MRO : Maintenance, Repair and Overhaul
TOPSIS : Technique for Order Preference by
Similarity to Ideal Solution
COPRAS : Complex Proportional Assessment
GRA : Grey Relational Analysis
FBWM : Fuzzy Best–Worst Method
EDAS : Evaluation based on Distance from
Average Solution
AHP : Analytic Hierarchy Process
ELECTRE: Elimination and Choice Expressing
Reality
BWM : Best–Worst Method
MAIRCA : Multi-Attributive Ideal-Real
Comparative Analysis
MABAC : Multi-Attributive Border Approximation
Area Comparison
PIPRECA : Pivot Pairwise Relative Criteria
Importance Assessment
IT2F : Interval Type-2 Fuzzy
WASPAS : Weighted Aggregated Sum Product
Assessment
CODAS : Combinative Distance-based
Assessment
THY : Türk Hava Yolları
FUCOM : Full Consistency Method
CoCoSo : Combined Compromise Solution
LOPCOW: Logarithmic Percentage Change-Driven
Objective Weighting
AROMAN : Alternative Ranking Order Method
Accounting for Two-Step
Normalization
SWARA : Stepwise Weight Assessment Ratio
Analysis
VIKOR : VlseKriterijumska Optimizacija I
Kompromisno Resenje
AISM : Adversarial Interpretive Structural
Model
References
Abdel-Basset, M., Ding, W., Mohamed, R., & Metawa, N., 2020. An integrated plithogenic MCDM approach for financial performance evaluation of manufacturing industries. Risk management, 22, 192-218.
Altınkurt, T., & Merdivenci, F., 2020. AHP tabanlı EDAS yöntemleriyle havayolu işletmelerinde hizmet kalitesinin değerlendirilmesi. Aksaray Üniversitesi İktisadi ve İdari Bilimler Fakültesi Dergisi, 12(4), 49-58.
Altin, F. G., Karaatlı, M., & Budak, İ., 2017. Avrupa’nin en büyük 20 havalimaninin çok kriterli karar verme yöntemleri ve veri zarflama analizi ile değerlendirilmesi. Süleyman Demirel Üniversitesi İktisadi ve İdari Bilimler Fakültesi Dergisi, 22(4), 1049-1064.
Antonelli, C., Orsatti, G., & Pialli, G., 2023. The effects of the limited exhaustibility of knowledge on firm size and the direction of technological change. The Journal of Technology Transfer, 48(4), 1359-1385.
ATAG, 2014. Aviation benefits beyond borders. [Online] Available at: http://aviationbenefits.org/media/26786/ATAG__AviationBenefits2014_FULL_LowRes.pdf
Bae, K., Gupta, A., & Mau, R., 2021. Comparative analysis of airline financial and operational performances: A fuzzy AHP and TOPSIS integrated approach. Decision Science Letters, 10(3), 361-374.
Bakır M. & Alptekin N., 2018. Hizmet Kalitesi Ölçümüne Yeni Bir Yaklaşım: CODAS Yöntemi İle Havayolu İşletmeleri Üzerine Bir Uygulama. BMIJ, 6(4): 1336-1353.
Bakır, M., & Atalık, Ö., 2018. Entropi ve Aras yöntemleriyle havayolu işletmelerinde hizmet kalitesinin değerlendirilmesi. İşletme Araştırmaları Dergisi, 10(1), 617-638.
Bakır, M., & İnce, F., 2024. Havayolu İşletmelerinde Yolcu Memnuniyetinin LOPCOW-AROMAN Modeliyle Analizi: Star Alliance Stratejik Ortaklığı Uygulaması. Dumlupınar Üniversitesi Sosyal Bilimler Dergisi, (81), 168-189.
Bakir, M., Akan, Ş., Kiraci, K. et al., 2020. Multiple-criteria approach of the operational performance evaluation in the airline industry: Evidence from the emerging markets. Romanian Journal of Economic Forecasting, 23(2), 149-172.
Baños‐Caballero, S., García‐Teruel, P. J., & Martínez‐Solano, P., 2010. Working capital management in SMEs. Accounting & Finance, 50(3), 511-527.
Beranek, W., Cornwell, C., & Choi, S., 1995. External financing, liquidity, and capital expenditures. Journal of Financial Research, 18(2), 207-222.
Bharadwaj, V. N., Shashank, P. S., Harish, M., & Garre, P., 2015. A review on lean manufacturing to aerospace industry. International Journal of Engineering Research and General Science, 3(4), 429-439.
Boeing, 2024. Close Relationships with Global Stakeholders are Key. [Online] Available at: https://www.boeing.com/company/key-orgs/boeing-global#global-focus
Boz E., Çizmecioğlu S. and Çalık A., 2023. Air cargo company selection under a state of chaos: An integrated bayesian BWM and WASPAS approach. Journal of the Faculty Engineering and Architecture of Gazi University, 38(3), 1589–1600.
Çakir, S., & Perçin, S., 2013. Çok kriterli karar verme teknikleriyle lojistik firmalarinda performans ölçümü. Ege Akademik Bakis, 13(4), 449.
Çetin, A. & Altan, Ş., 2019. Bulanik TOPSIS yöntemiyle havayolu şirketleri performans değerlendirmesi: Esenboğa Havalimaninda bir uygulama. Giresun Üniversitesi İktisadi ve İdari Bilimler Dergisi, 5(9), 40-61.
Diakoulaki, D., Mavrotas, G., & Papayannakis, L., 1995. Determining objective weights in multiple criteria problems: The critic method. Computers & Operations Research, 22(7), 763-770.
Dilmen, E., & Çetinyokuş, T., 2020. Potansiyel çoklu havalimani sisteminin çok kriterli karar verme yöntemleri ile değerlendirilmesi. Niğde Ömer Halisdemir Üniversitesi Mühendislik Bilimleri Dergisi, 9(2), 859-876.
Eriksson, S., 2023. Technology policies in east and Southeast Asia: Creating a new global structure in the aircraft industry. Asian Geographer, 22(1-2), 169–185.
Gedik, M. S., & Bayram, Ö. Ö., 2022. Avrupa’daki düşük maliyetli havayolu işletmelerinin kabin hizmeti kalitesinin ENTROPI tabanli ARAS yöntemleri ile değerlendirilmesi. Retorik Dergisi, 2(2), 71-85.
Hausmann, R. et al., 2011. The Atlas of Economic Complexity: Mapping Paths to Prosperity. Cambridge, MA: The MIT Press.
Houqiang, Y., & Ling, L., 2012. Five kinds of enterprise comprehensive evaluation based on the entropy value method and the CRITIC method. Journal of Hubei Institute of Technology, 32, 83–84.
Hsieh, H. P., Wu, Y. C., Lu, W. M., & Chen, Y. C., 2020. Assessing and ranking the innovation ability and business performance of global companies in the aerospace and defense industry. Managerial and Decision Economics, 41(6), 952-963.
ICAO, 2013. ICAO 2013 environmental report. [Online] Available at: http://cfapp.icao.int/Environmental-Report-2013
Ilgaz Yıldırım, B., Uysal, F., Ilgaz, A., 2019. Havayolu işletmelerinde personel seçimi: ARAS yöntemi ile bir uygulama. Süleyman Demirel Üniversitesi Sosyal Bilimler Enstitüsü Dergisi, 2(33), 219-231.
Keleş, M. K., 2022. CRITIC temelli MABAC yöntemi ile Türk Hava Yollarının yıllara göre performansının değerlendirilmesi. Mehmet Akif Ersoy Üniversitesi Uygulamalı Bilimler Dergisi, 6(1), 53-67.
Keleş, M. K., Özdağoğlu, A., & Işıldak, B., 2021. Yolcular açısından havalimanlarının değerlendirilmesine yönelik çok kriterli karar verme yöntemleriyle bir uygulama. Ankara Hacı Bayram Veli Üniversitesi İktisadi ve İdari Bilimler Fakültesi Dergisi, 23(2), 419-456.
Khalid, W., & Khan, S., 2017. Impact of Operating and Financial Expenses on Sales Revenue: The Case of Fauji Fertilizer Company Limited. International Journal of Business and Economics Research, 6(3), 40-47.
Kılıçlı, Y., & Aygün, M., 2023. Kurumsal sosyal sorumluluğun finansal performans üzerindeki etkisi. Uluslararası Yönetim İktisat ve İşletme Dergisi, 19(1), 187-210.
Kim, J. Y. et al., 2011. A new method for automatic areal feature matching based on shape similarity using CRITIC method. Journal of the Korean Society of Surveying, Geodesy, Photogrammetry and Cartography, 29(2), 113–121.
Kiracı, K., & Akan, E., 2020. Aircraft selection by applying AHP and TOPSIS in interval type-2 fuzzy sets. Journal of Air Transport Management, 89, 101924.
Kiracı, K., & Bakır, M., 2019. CRITIC temelli EDAS yöntemi ile havayolu işletmelerinde performans ölçümü uygulaması. Pamukkale Üniversitesi Sosyal Bilimler Enstitüsü Dergisi, (35), 157-174.
Kurt, G., & Kablan, A., 2022. Covid-19’un havayolu işletmelerinin finansal performansı üzerindeki etkilerinin analizi. İşletme Akademisi Dergisi, 3(1), 16-33.
Macit, D., & Göçer, S. G., 2020. Havayolu işletmelerinin finansal performanslarının ölçülmesi: Pegasus ve THY örneği. Ordu Üniversitesi Sosyal Bilimler Araştırmaları Dergisi, 10(3), 904-918.
Madic, M., & Radovanovic, M., 2015. Ranking of some most commonly used non-traditional machining processes using ROV and CRITIC methods. UPB Scientific Bulletin, Series D, 77(2), 193–204.
Mercan, T., & Can, A., 2023. İşgören Seçiminde Etkili Olan Faktörlerin FUCOM Yöntemi ile Değerlendirilmesi. Süleyman Demirel Üniversitesi Vizyoner Dergisi, 14(40), 1311-1329.
Niosi, J., & Zhegu, M., 2005. Aerospace clusters: local or global knowledgespillovers. Industry Innov, 12(1), 5–29.
Noll, T., 2015. Safety, dependability and performance analysis of aerospace systems. Formal Techniques for Safety-Critical Systems, pp. 17-31. Springer.
Ömürbek, Y., & Kınay, Ö., 2013. Havayolu taşımacılığı sektöründe Topsis yöntemiyle finansal performans değerlendirmesi. Süleyman Demirel Üniversitesi İİBF Dergisi, 18(3), 343-363.
Özaslan, İ. H., Kocaoğlu, B., & Odabaşoğlu, Ş., 2021. Türkiye’de Pistonlu Tek Motorlu Uçak Seçiminde Çok Kriterli Karar Verme Ahp ve Topsis Yöntemlerinin Kullanılması. Journal of Aviation Research, 3(2), 243-263.
Özbek, A., & Ghouchi, M., 2021. Finansal oranları kullanarak havayolu şirketlerinin performans değerlendirmesi. International Journal of Engineering Research and Development, 13(2), 583-599.
Özdağoğlu, A., Keleş, M. K., & Işıldak, B., 2020. Isparta Süleyman Demirel Havalimanını kullanan havayolu firmalari performanslarinin BWM, MAIRCA ve MABAC ile değerlendirilmesi. Uluslararası İktisadi ve İdari İncelemeler Dergisi, (29), 175-194.
Öztürk, D., & Onurlubaş, E., 2019. Havayolu taşımacılığında hizmet kalitesinin AHP ve TOPSİS yöntemleri ile değerlendirilmesi. Gümüşhane Üniversitesi Sosyal Bilimler Dergisi, 10, 81-97.
Ping, X., 2011. Application of CRITIC method in medical quality assessment. Value Engineering, 1, 200-201.
Raj, A., & Srivastava, S. K., 2018. Sustainability performance assessment of an aircraft manufacturing firm. Benchmarking: An International Journal, 25(5), 1500-1527.
Rehwinkel, A., 2016. Corporate financial risk analysis according to the constructal law. International Journal of Heat and Technology, 34(1), 133-140.
Sarıgül, S. S., Ünlü, M., & Yaşar, E., 2023. A new MCDM approach in evaluating airport service quality: MEREC-based MARCOS and CoCoSo methods. Uluslararası Yönetim Akademisi Dergisi, 6(1), 90-108.
Seker, S., 2024. Evaluation of agile attributes for low-cost carriers to achieve sustainable development using an integrated MCDM approach. Management Decision.
Singamneni, S. et al., 2019. Additive manufacturing for the aircraft industry: a review. J. Aeronaut. Aerosp. Eng, 8(1), 351-371.
Tezcan, M. C., 2024. Pisagor Bulanık Kümelere Entegre AHP ve TOPSIS Yöntemleri ile Uçak Tipi Seçiminin Optimizasyonu. Journal of Aviation Research, 6(1), 1-24.
Vermeulen, B., & Van Tooren, M. J. L., 2006. Design case study for a comparative performance analysis of aerospace materials. Materials & Design, 27(1), 10-20.
Xie, H. et al., 2024. Evaluating airline service quality through a comprehensive text-mining and multi-criteria decision-making analysis. Journal of Air Transport Management, 120, 102655.
Xie, Y., & Li Z. J., Xu, Z., 2014. Evaluation on spontaneous combustion trend of sulfide ores based on the method of CRITIC and TOPSIS testing method. Journal of Safety and Environment, 14(1), 122–125.
Zavadskas, E. K., & Turskis, Z., 2010. A new additive ratio assessment (ARAS) method in multicriteria decision-making. Ukio Technologinis ir Ekonominis Vystymas, 16(2), 159-172.