

Abstract
This paper presents the wing design and structural analysis of a single turboprop aircraft with a maximum take-off weight of 2,200 lbs. The aircraft’s wing structure is a conventional mid-wing configuration of a twisting trapezoidal planform with an aspect ratio of 0.6. The analysis involved determining the loads acting on the wing structure. That is, the aircraft’s flight envelope and the wing’s critical loading condition are according to Title 14 Code of Federal Regulations Part 23 (14 CFR Part 23). The wing CAD model, composed of the aircraft wing components of the spar, ribs, and skins, including its layout, was developed and analyzed based on available 7075T6 Aluminum sheets using the SolidWorks software. The results for the wing’s critical loading condition showed that the wing tip displacement was less than 5% of the half-wingspan with a margin of safety of 0.5 and a mass of 117.97 lbs which was less than the expected mass of 132 lbs.
Keywords
- Wing Structural Design
- Finite Element Analysis
- Normal Category Aircraft
- 14 CFR Part 23
- Single Turboprop Aircraft
1. Introduction
Developing an aircraft involves a lot of effort regarding the market, technical data, commercial analysis, existing and competitive aircraft, payload, range, mission, organizing the design process, airworthiness and other standards, systems and equipment requirements, and innovation toward the world needs (Brandt et al., 2004; Jenkinson and Marchman III, 2003; Raymer, 1992). The aviation sector had been growing rapidly prior to the pandemic in 2019, that has had a major impact not only on aviation but also on the world economy. Now, after almost two years, the general aviation sector has started to make a good recovery. The General Aviation Market Association recently released its aircraft shipment report that indicated a 45.4% increase in turboprop aircraft in the first six months of 2021 compared to the same period in 2020, as the highest growth among all types (Table 1).
As mentioned earlier, the private aircraft industry is a market that is expected to grow significantly in the future. According to statistical data, leading companies in the United States could sell more aircraft each year if the recent COVID-19 pandemic did not exist. The largest market for the aircraft models that are used for general aviation (GA) operations in the United States, accounting for more than 60% of global private jet sales. The Asian market is less than 10%, and the future is certainly growing in Asia (Deane, 2022). This business opportunity caused a Thai entrepreneur who had experience in the business of assembling kit planes to see the direction and the gap and, therefore, come up with the idea of producing the first Thai brand of a fixed-wing aircraft. To achieve this, the company has a business model for developing a two-seater aircraft (Pengsiri, 2020) and other models in partnership with several institutions, state-owned and private sectors. The roadmap for the first fixed-wing aircraft model is to initially design an all-metal aircraft, for which the wing’s structural layout is the purpose of this paper. Then, the structure will be replaced with composite material and be converted to electric aircraft for the air transportation needs of Thailand’s sustainability and worldwide market.
Table 1. First Half Aircraft Shipments and Billings (Castro, 2020).

This paper focuses on the conventional aircraft model powered by a single turboprop engine. The design and structural analysis of the wing’s structure for a two-seater aircraft involves the input of the following specifications:
- Maximum Take-off Weight 2,200 lbs
- Basic Empty weight 990 lbs
- Maximum Usable Fuel 616 lbs
- Maximum Usable Load 264 lbs
- Engine power 240 hp
- Take-off 1,312 ft
- Take-off over 50 ft Obstacle 1,968 ft
- Climb Rate 3,000 ft/min
- Maximum Operate Altitude 28,000 ft
- Stall Speed with Flaps 61 KCAS
- Maximum Cruise Speed 320 KTAS
- Landing Ground roll 1,148 ft
- Wingspan 28.5 ft
- Length 21.0 ft
- Height 8.92 ft
- Cabin Width 4.13 ft
- Wing Area 95.1 ft2
- Taper Ratio 0.6
- Airfoil NACA 652-415
The wing structural mass was defined as being 12% of the maximum take-off weight (MTOW), which is 264 lbs. The geometric wing twist is the wash-out type, distributed along the span by the wing incidence angle at the root of 3 degrees and the tip of -3 degrees.
This study presents the design of a simplified conventional aircraft wing made of aluminum. The simplified model of the wing structure consists of a single or box-shaped spar, ribs, and skin, excluding stringers. The combined flight envelope was calculated to present the most critical flight condition in the normal category aircraft according to Title 14 Code of Federal Regulations Part 23 (14 CFR Part 23) (FAA, 2018). The lift magnitude and distribution over the wingspan were determined for the simulation. The analysis was carried out to estimate the structural responses in terms of overall strength and tip deformation by the following objectives:
- Symmetrical positive and negative limit maneuvering load factor
- Mid wing stiffness: wing tip displacement < 5% of the wing’s half span
- Wing mass estimation < 12% of maximum take-off weight
- Margin of Safety > 0.5
2. Theoretical Background
One of the most important factors to be considered in this section is the forces on the wing. All forces exerted on the wing by air loads from the speed of the aircraft and the strength of the wind in terms of gust wind speeds. The wing design of an aircraft requires a flight envelope, including gust speed, to ensure the operation of the aircraft and identify the maximum load factor that could be applied to the structure.
2.1. Aircraft flight envelope (gust included)
When the aircraft is flying, it is obviously required to be capable of operating in all weather conditions. The wing is the most important component of an aircraft for generating lift while moving forward in the air. Design wing loads consist of the loads exerted on the wing structure when maneuvering to the limits of the flight envelope, also known as the V-n diagram. The flight envelope is a plot of load factor versus airspeed (Anderson, 1999; Bruhn, 1973; Curtis, 1997; Megson, 1999; Niu, 1988). It combines both aerodynamic and structural limitations of an aircraft. In the same meaning, it presents the maneuver boundaries for a given aircraft. A flight envelope is generally illustrated in Fig. 1 (top). Considering the positive load factor region, the maximum positive lift capability represents the aerodynamic limitation resulting from the maximum lift coefficient of the selected airfoil for the wing. The aircraft will stall over this curve, which is a parabolic trend from the well-known lift force equation as
![]() (1)
(1)
where is the load factor, W is the aircraft weight, is the air density, V is the airspeed, S is the wing area, and is the maximum lift coefficient.
Similarly, the maximum negative lift capability is the aerodynamic boundary for the aircraft with a negative load factor controlled by the airfoil shape. There are four horizontal lines in Fig. 1 (top) that represent structural limitation by limit and ultimate load factor in both positive and negative regions.
Fig. 1. (top) Typical and (bottom) combined flight envelope (Niu, 1988).
The values of limit and ultimate load factors depend on the mission, such as heavy bombers, cargo and passenger transports, light planes, advanced trainers, primary trainers, and military fighters. The single-vertical line also represents a structural limitation at a design dive speed (VD). This is the maximum speed chosen for the aircraft’s performance and operational requirements. To avoid penalizing the aircraft weight, care must be taken on the design dive speed. The aircraft structure must be designed to withstand the maximum load factor, including the nature of atmospheric turbulence in terms of gust effect. The additional loads imposed on the wing structure due to turbulent air may be greater than the maximum load factor in the typical flight envelope. As shown in Fig.1 (bottom), this combined flight envelope is the aircraft flight envelope with gust effect. The gust load factor is an additional load factor when the aircraft flies into the turbulence air gathered from statistical data. A simple equation represents the gust velocity in the vertical direction, resulting in an increased load factor from a level flight (n = 1) as follows:
![]() (2)
(2)
where which is the gust alleviation factor introduced in order to account for the behavior of the gust, which does not act instantaneously but rather in a sinusoidal manner, which is the mass ratio in order to take into account the aircraft’s dimension-the effect of the gust will be faster for the lighter aircraft, is the gravitational acceleration of the Earth, is the mean aerodynamic chord, is the lift-curve slope, is the design gust velocity that is normally ±25, ±50, and ±60 ft/s depending on airworthiness authorities (FAA, 2018; EASA, 2017; CAAT, 2019), and is the flight airspeed.
2.2. Spanwise lift distribution
The analysis of forces on the wing is essential to determine the lift required to be input into the simulation. Spanwise lift distribution was calculated using the lifting-line theory initially developed by Prandtl (Sadraey, 2013). First, the wing was divided into N segments along the span with each corresponding angle q, as shown in Fig. 2.
Fig. 2. Angles correspond to each segment in the lifting-line theory.
The aim was to solve for coefficients A1 to An using the following equation:
![]() (3)
(3)
where a is the segment’s angle of attack and a0 is the segment’s zero-lift angle of attack. The parameter m is defined as:
![]() (4)
(4)
Where is the segment’s mean geometric chord, is the segment’s lift curve slope, and b is the wingspan. Each segment’s lift coefficient was finally determined using the equation:
![]() (5)
(5)
The spanwise lift distribution is estimated using unit load analysis in accordance with the segment’s lift coefficient (Bruhn, 1973). Because this load acts through the 40 percent chord line at each station, it results in the distribution of shear force, bending moment, and torsion for a level flight (n = 1) under certain flight conditions. The maximum load factor will then be multiplied at the corresponding airspeed to determine the most critical flight condition.
2.3. Required strength of the wing’s structure
The structural limitations in aircraft design are generally divided into two categories: limit and ultimate load factor (Pengsiri, 2020; Castro, 2020; FAA, 2018; Megson, 1999). The limit load factor is the boundary where permanent structural deformation of the aircraft occurs, while ultimate load factor is the boundary that the aircraft structure will break. The margin of safety (M.S.) in terms of the ultimate strength and allowable stress can be expressed as
(6)
2.4. Simplified modeling
Due to the symmetry related to the mid-fuselage, only the half wing was modeled. Two models were initially created by assembling the main components of the wing structure, including the rib, skin, and single or box spar.
The rib spacing in the original wing model was set with even spacing at least one-fifth of the chord (Zahm, 1920). Fig. 3 (left) shows the main components of the wing structure with a single spar located at 40% of the chord length along the wingspan. Fig. 3 (right) is the half-wing model with the box spar replacing the single spar in the left picture. The wing loading obtained from the previous section was considered when designing the components based on simple beam theory (Curtis, 1997; Megson, 1999). The thickness of each component is assigned according to the available thickness of the sheet (Table 2). The wing model was developed with constant taper and twist and used 7075T6 aluminum sheets, with its material properties shown in Table 2. The model was prepared as a surface with no defined thickness, which was later identified in the pre-processing tool.
Table 2. Properties of 7075T6 aluminium sheet (Aircraft Spruce, 2020).

Fig. 3. Half-wing layout with (left) single and (right) box spar.
All wing components were created as 2D shells. The wing is fixed at the root. The loads are applied as obtained from the spanwise lift distribution. The structural response was simulated and analyzed to fulfill the objectives of this study, which are strength, deformation, and weight.
3. Results and Discussion
3.1. Extreme load factor identification
A combined flight envelope was written in the Mathcad program. Referring to Title 14 Code of Federal Regulations Part 23 (14 CFR Part 23), the maximum positive and negative load factors for the normal category are +3.8 and -1.5, respectively. The stall speed was determined at the corresponding maximum lift coefficient of the NACA 652-415 airfoil (Abbott and Von Doenhoff, 1958), while the dive speed was 1.4 times the cruise speed. Gust wind speeds of 25 and 50 ft/s were included in determining the load factors, both positive and negative, at the maximum operation speed (VCmax) and dive speed, respectively. The aircraft flight envelope is a diagram that maps the possible combination of minimum and maximum values of speed versus load factor that the aircraft can experience during flight. The aircraft can operate without suffering permanent deformation or structural damage. This envelope combines the maneuvering envelope and the gust envelope, as shown in Fig. 4 from the aircraft specifications given in Section 1.
Fig. 4. Combined flight envelope.
There are 17 points that play an important role in the flight maneuver for this aircraft, as illustrated by the points A to Q in Fig.4. The combined flight envelope shows a plot of load factor versus equivalent airspeed in knots. Point A is the point of zero magnitudes for both load factor and airspeed. Point B represents an airplane flying at level flight with a speed of 77.84 knots, which is also the stall speed. Point C is the corner speed that presents the point of the highest load factor at the stall speed for the aircraft. The flying condition at this point is also well-known as the positive high angle of attack (PHAA) condition. The aircraft’s wing structure will be subjected to the maximum compression in the upper flange of the forward stiffener, while the maximum tension will be generated in the lower flange of the rear stiffener for the conventional wing box structure. The aerodynamic limit, obtained from the maximum lift coefficient, is the curve between points B and C. The region above this line is the stall region. The horizontal line CG denotes the positive limit load factor at speed between 151.73 knots and 284.11 knots; the former is the corner speed, and the latter is the dive speed. Point G is also called a “positive low angle of attack” (PLAA) condition, where the highest compression will occur at the rear longeron in the upper flange while the highest tension will occur at the forward longeron in the lower flange.
Point O represents the level of flight for the aircraft at no speed, as shown by n = 1 intersecting the Y-axis. The line OE denotes the variation of the load factor at a gust speed of 25 ft/s, which means that the additional load factor is linearly proportional when increasing airspeed. The intersection of the gust speed at 25 ft/s and the maximum cruise or operating speed is at point E. The straight line between the points D and E shows the additional gust load factor that becomes n = 4.31 obtained by eq.2 with the gust wind speed of 25 ft/s, which is the maximum positive load factor at the maximum cruise speed of the aircraft. The load factor at point G at the dive speed is 3.8. The gust speed of 50 ft/s has no influence on the maximum load factor specified in the normal category, with the intersection of the gust line and dive speed being less than 3.8. The vertical line GH represents an airplane flying at a dive speed with a load factor of between 3.8 and -1.32.
The combined flight envelope in the negative load factor zone is plotted in the same manner as the positive one. The speed at point L is greater than that at point B, which is 88.39 knots, due to the unsymmetrical airfoil. The line NB and ML show the level flight condition of the aircraft in the positive and negative load factors, respectively. The curve between points L and K is the stall limit in the negative region. The aircraft velocity corresponding to point K is 104.59 knots, which is less than the corner speed. This point is also called “negative high angle of attack” (NHAA), where the highest compression will occur in the forward longeron in the lower flange while the highest tension will occur in the rear longeron in the upper flange. The limit load factor in the negative region is -1.5, which is the horizontal line passing through points K. The highest load factor, calculated from the gust airspeed of -25 ft/s, is -2.31 at the maximum operating speed as represented by the point I. The wing’s structure requires to withstand the load factor of -2.31 at this point. It is noted that the load factor at the point I is lower than the minimum load factor where the flight envelope with combined gust calls the “negative low angle of attack at the maximum operation speed” (NLAA, VCmax) condition. It means that the aerodynamic force on the wing at the point I will cause maximum compression in the lower flange rear longeron and maximum tension in the upper flange forward longeron. Analogous stress acting on the wing from the flight behavior of point I can be stated at point H, the “negative low angle of attack” at the operating speed (NLAA, VD) condition. Point H shows the intersection between the dive speed and the total load factor resulting from the gust airspeed of -50 ft/s where the wing’s structure is required to withstand the load factor of -1.32. It is noted that the load factor at point H is greater than the minimum load factor where the flight envelope with combined gust calls the “negative low angle of attack at the design dive speed” (NLAA, VD) condition.
The combined flight envelope with flap down, shown as the curve between points A and P, expands the stall region by reducing the stall speed for level flight to 58.75 knots at point Q compared to the flap up condition with the stall speed for the level flight of 77.84 knots at point B. However, the load factor is limited by 2 in the case of flap deployment due to the generation of too much lift. The wing structure layout and dimension will be designed, requiring a different load factor according to the aircraft type.
The design of the wing’s structure must take the largest expected load into account. The maneuver boundaries, including gust effects, show the value of the maximum load factor corresponds to that at either point E or G in Fig. 4 in the positive region, while the minimum load factor is not the critical load due to the shape of the airfoil. It means that the maximum operating speed intersects with the gust load factor of 25 ft/s at n = 4.31, and the dive speed intersects with the gust load factor of 50 ft/s at n = 3.8 from the diagram. Both points were compared based on the spanwise lift distribution at n = 1 to identify the maximum values of the load factor expected to occur with the wing’s structure.
From the calculation, the aerodynamic forces acting on the center of pressure, denoted by c.p., are approximately located at 0.40 of the airfoil’s chord point, measured from the leading edge. A set of Microsoft Excel® workbooks created shows the spanwise distribution of lift, shear force (V), bending moment about 40% chord (Mx40%c), and torsion about 40% of the chord (T) for a level flight (n = 1) at the critical flight condition as described in calculating wing shears and moments for one unit load condition on half-wing (Bruhn, 1973). Fig. 5 shows the lift distribution on the half-wing at n = 1 for the same speed of points E and G, corresponding to VCmax and VD, respectively. The curve demonstrates an elliptical lift distribution applied to the half of the wing, where the maximum value occurs at the root of the wing and zero at the tip. The lift force distribution when the aircraft flies at maximum cruise and dive speeds is approximately 19.04 and 37.89 lb/in. It is noted that the pressure distribution generated by moving air results in the lift and drag force acting at the center of pressure. The resultant drag is neglected in this study. The lift resultant is considered to act at 40% of the chord point and results in torsion distribution by aerodynamic forces along the wingspan.
Fig. 5. Lift distribution on half-wing at n=1.
This study was carried out with the aircraft’s fuselage oriented along the X-axis, the Y-axis oriented vertically, and the Z-axis perpendicular to the plane XY. The shear force distribution was obtained by the numerical integration of the spanwise lift distribution. The bending moments (Mx) could similarly be constructed with the numerical integral of the shear distribution. Fig. 6 shows results from the calculation of wing shear (V) and wing bending moments due to wing structure weight and lift acting upward in the Y direction and applied at 0.4 of the chord’s length. They were calculated in a spanwise direction when the aircraft is flying in a level flight condition (n = 1). The results show the critical shear force and bending moment occur at a diving condition corresponding to 4,407 lbs and 312,555 in-lb compared to 2,207 lbs and 155,970 in-lb for the maximum operating speed. The load factor of 3.8 at the dive speed, therefore, is the most critical condition for the wing structure design concerning the combined flight envelope.
The distribution of shear force and torsion about 40% chord along the wingspan was generated when the aircraft flew at dive speed and n = 3.8, which is the maximum load factor (Fig.7). The fuselage size was taken into the calculation for the wing configuration of the mid-fuselage type. At the dive speed and the maximum load factor (n = 3.8), the total shear force applied to the wing’s structure was 16,747 lbs. The shear force (V) was varied along the Z-axis using reference coordinates that were initially located at 40% of the chord length and was calculated using the equation:
![]() (7)
(7)
Similarly, the variation of torsion was applied to the wing spar at approximately 40% of the chord length, with a total intensity of 57,762 in-lb using the equation:
![]() (8)
(8)
3.2. Wing structural analysis
Static studies were carried out to observe the structural behavior with the mesh preview as shown in Fig. 8. The thicknesses of each surface were visualized and checked to see if they were as expected. The analysis with a single spar layout is initially generated. The model shows each rib was placed every 10” from root to tip, except for the last bay, where the spacing is greater than the other bays to fit with the semi-span length. All surfaces were divided into several small elements using a curvature-based mesh. A convergence study was carried out to find the optimum element size and was adopted in all the models. The maximum and minimum element sizes were 3” and 1”, respectively. The left picture in Fig. 3 represents six simplified models in Table 3. The models were created with 15 ribs, 14 bays, 56 flanges, and 28 skins. Table 3 describes six models with different thickness attributions. For the first model (Model 1), a constant thickness is specified for the same component. The ribs and the spar webs had a thickness of 0.063”. The thickness of the spar flanges was made using three layers of 0.125” aluminum plate; therefore, it is 0.375”. All skins had a thickness of 0.04”. The total structural weight for the Model 1 was estimated to be 129.85 lbs. The simulation results show the maximum Von Mises stress is 46.5 ksi and the tip deformation is 7.31”. This results in an unsatisfactory margin of safety as described in Table 3. It is expressed with an alphabet “U” in the evaluation row for Model 1.
Fig. 8. Mesh preview for the different spar layouts: (left) single and (right) box spar.
The Model 2 was a modification of the Model 1 by increasing the spar web thickness to 0.125”, but the result was still unsatisfactory for the reason of being overweight. The modification, Model 3, still focused on the spar web thickness by keeping the first three bays from the root at a thickness of 0.125” and using a thickness of 0.063” for the rest. All objectives were satisfied, or S, as shown in the table. The Model 4 was indeed satisfied by using the ribs’ thickness of 0.04” to reduce weight. The last two models, Models 5 and 6, were studied by focusing on thinner sheets for some parts of the spar flanges and webs. However, unsatisfactory results were obtained from the simulation. All results show that the wing’s structure with a layout of a single spar was not effective in terms of strength, deformation, weight, and margin of safety. This led to using the layout of a box beam spar, as shown in the right picture in Fig. 3.
A modified model was developed by replacing a single spar with a box spar, as described in Table 4. As it was a simplified model, the number of the spar web components was directly doubled to 28 pieces. The Model 7 is developed with a constant thickness for the same component. The ribs and the spar webs had a thickness of 0.05”. The thickness of the spar flanges was made using two layers of 0.125” aluminum plate; therefore, 0.25”. All skins had a thickness of 0.04”. The total structural weight for the Model 7 was estimated to be 108.20 lbs. The simulation results show the maximum Von Mises stress is 58.63 ksi and the tip deformation is 10.13”. This results in both an unsatisfactory margin of safety and displacement. This led to a modification by increasing the thickness of the flange to only three bays from the wing root, but the results were still unsatisfactory for the Model 8. The Model 9 was generated to reduce the maximum stress so that the spar webs were thicker at three bays from the wing root. The Model 10 was modified from the Model 9 with an increased thickness of 0.125-inch for the spar web and, to keep the weight within the limitation, the ribs had a thinner plate for the one that does not belong to the three bays from the root. The results from the simulation greatly reduced the maximum stress, but the tip displacement was still unsatisfied with the design framework. Model 11 was the last one that corresponded to the right picture in Fig.3 and the first model in Table 4 that met the objectives of this study by using a 0.375-inch flange thickness. However, the total weight was quite heavy towards the limit, so the Model 12 was generated to mainly focus on the uneven spacing of the wing ribs, as illustrated in Fig. 9, since the stress concentration zone was located near the wing root.
Table 3. The model with a single spar.

Table 4. The model with box spar.
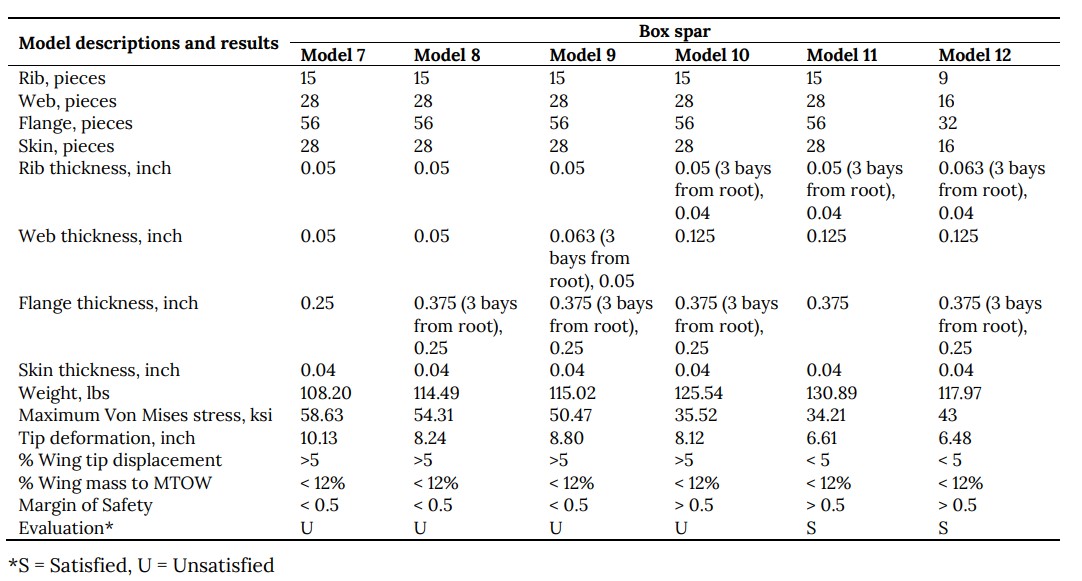
Fig. 9. Wing model from top, side, front, and 3D view.
The wing design was finally created with a box spar layout. For weight reduction purposes, the ribs had three circular cut-outs. The model consisted of nine ribs, eight bays, 32 flanges, and 16 skins, as described in Model 12 of Table 4. Fig. 9 shows multiple drawing views of the wing model: top, side, front, and 3D view. Different thicknesses were defined for the wing model, as illustrated in Fig. 10. All skins had a thickness of 0.04”, and the spar webs had a thickness of 0.125”. The thickness of the spar flanges corresponding to bays 1 to 3 from the wing root used three layers of 0.125” aluminum plate. In comparison, the rest of the flanges had only two layers. The four ribs on the root side had a thickness of 0.063”. In contrast, the rest had a thickness of 0.04”. The total structural weight was estimated to be 117.97 lbs, which was less than the wing mass estimation of 132 lbs.
Fig. 10. The thickness of each surface: from a top (left) and bottom isometric view (right).
3.3. Discussion
The static structural analysis was performed to provide the wing layout for a single turboprop normal category aircraft. The most critical flight condition was identified at the dive speed with a load factor of 3.8. The wing’s structure is subjected to estimated lift and torsion distribution. Fixed support is applied at one end of the wing as it is attached to the fuselage’s structure. The models using shell elements present a wing structure, with the box spar layout being more effective than the one with the single spar layout at the preliminary aircraft design stage. The results could give more ideas about the loading combination of lift and torsion distribution that might be too complex to estimate from a simplified calculation for the same loading. The output in terms of Von Mises stress and displacement is shown in Fig. 11 (top) and Fig. 11 (bottom), respectively. It is obvious that the Von Mises stress is locally high at the wing root because this is the fixed end location of the defined boundary condition. Localized stresses exist at the skin, spar, and rib connections, but they are not severe enough to cause catastrophic failure of the wing’s structure. The stress contour shows the region having a margin of safety of 0.5 at the wing-fuselage junction. This region could be reinforced during the manufacturing process. It was noted that the maximum displacement of 6.48” occurred at the wing tip, which satisfied the constraint of being less than 5% of the wing’s half span. The wing gradually twisted and deformed in its spanwise direction. It is in accordance with the applied load and boundary condition.
The equal rib spacing was designed for the initial model. The structural analysis was carried out to adjust the layout of the main components under the extreme flight conditions obtained from the flight envelope. The maximum stress should be less than 43 ksi to keep the margin of safety within the framework. Increasing the thickness of each component could increase the margin of safety but put a penalty on the weight. The final wing structure layout was optimized in all conditions. This methodology could be implemented for the model made of composite material later.
Fig. 11. Von Mises stress of the wing (top) and wing displacement (bottom).
4. Conclusions and Further Studies
Based on the information presented in the flight envelope and the critical wing loading, an initial wing structure was developed that met all aircraft structural and operational requirements according to Title 14 Code of Federal Regulations Part 23 (14 CFR Part 23). The structural behavior of a three-dimensional wing has been simulated using single and box spars based on the shell element type. The simplified model successfully achieved the objectives of this study in terms of strength, displacement, and weight. However, the model is made entirely of aluminum. The design of the wing structure could be lighter and optimized with composite materials. The analysis with composite wings and electric aircraft is on the way according to the roadmap of the company toward Thailand’s sustainability. Further study could be done in many aspects, including analysis with stringers, cut-outs, and control surfaces, detailed design in the high-stress concentration region, wing design and optimization, buckling analysis, flutter analysis, composite material replacement, unsymmetrical flight condition, and construction and testing of individual components for structural integrity behavior.
CRediT Author Statement
Vis Sripawadkul: Conceptualization, Methodology, Software, Resources, Investigation, Writing-Review & Editing.
Phacharaporn Bunyawanichakul: Conceptualization, Methodology, Software, Resources, Investigation, Validation, Writing-Original Draft.
References
Abbott, I.H. and Von Doenhoff, A.E., 1958. Theory of Wing Sections. Dover Publications Inc.
Aircraft Spruce, 2020, Aircraft Spruce & Speciality Co., General Aluminum Information, Error! Hyperlink reference not valid.
Anderson, J.D., 1999. Aircraft Performance and Design. McGraw-Hill, ISBN 0-07-001971-1.
Bruhn, E.F., 1973. Analysis and Design of Flight Vehicle Structures. Jacobs & Associates Inc.
Brandt, S.A., Stiles, R. J., Bertin, J. J. and Withford, R., 2004. Introduction to Aeronautics: A Design Perspective. Second Edition. American Institute of Aeronautics and Astronautics Educational Series.
Castro, A., 2020. GAMA Publishes Second Quarter 2021 Aircraft Shipments and Billings Report, General Aviation Manufacturers Association, Error! Hyperlink reference not valid.
Curtis, H.D., 1997. Fundamentals of Aircraft Structural Analysis. McGraw-Hill.
Deane, S., 2022. 2022 Key Private Jet Industry Statistics – By Region, By Country, By Type, Stratos Jet Charters, Inc., https://www.stratosjets.com/blog/ private-jet-statistics/
European Aviation Safety Agency (EASA), 2017. Certification Specifications for Normal, Utility, Acrobatic, and Commuter Aeroplanes (EASA CS-23).
Federal Aviation Administration (FAA), 2018. United States Department of Transportation, Title 14 Code of Federal Regulations Part 23 – Airworthiness Standards: Normal, Utility, Aerobatic, and Commuter Category Aeroplanes (14 CFR Part 23).
Jenkinson, L.R. and Marchman III, J.F., 2003. Aircraft Design Projects for Engineering Students. First Edition. Butterworth-Heinemann.
Megson, T., 1999. Aircraft Structures for Engineering Students. Second Edition. Elsevier.
Niu, M.C.Y., 1988. Airframe Structural Design. Conmilit Press Ltd.
Pengsiri, J., 2020. JFOX Sport Thunder, JFOX Aircraft Co., Ltd., https://www.jfoxaircraft.com/aircraft/ sport-thunder
Raymer, D.P., 1992. Aircraft Design: A conceptual Approach. American Institute of Aeronautics and Astronautics.
Sadraey, M.H., 2013. Aircraft Design: A Systems Engineering Approach. Wiley.
The Civil Aviation Authority of Thailand (CAAT), 2019. Air Navigation Act B.E.2497 Section 34 (1). Airworthiness Standards: Normal, Utility, Acrobatic, and Commuter Airplanes. www.caat.or.th/th/archives/42000 [in Thai].
Zahm, A.F., 1920. Relation of Rib Spacing to Stress in Wing Planes. National Advisory Committee for Aeronautics: Technical notes No.5.


